
Forecasting 2026 hurricane season vendor demand starts with one rule: a seasonal outlook tells you how busy the basin may be, not where a storm will land, so emergency tarping capacity has to be sized for a landfall, not for the storm count. Tarpers is an emergency roof tarping company that works on assignment from property insurance carriers in Florida and Georgia, and this post walks through how claims leaders and vendor managers can turn the 2026 forecasts into a vendor capacity plan.
With the 2026 Atlantic season closing on November 30, now is the right time to compare what the forecasts said with what your vendor bench actually had to absorb, and to set buffer capacity for 2027 before the first outlook of the new year arrives.
What did the 2026 hurricane season forecasts predict?
Both major outlooks called for a quieter than average year. On May 21, 2026, NOAA predicted a below normal Atlantic season: a 55% chance of below normal activity, 8 to 14 named storms, 3 to 6 hurricanes and 1 to 3 major hurricanes, with El Niño expected to develop and intensify. NOAA compared that with an average season of 14 named storms, seven hurricanes and three major hurricanes.
In its August 6 update, NOAA raised the chance of a below normal season to 75% and trimmed its ranges to 7 to 13 named storms, 2 to 6 hurricanes and 0 to 2 major hurricanes. Colorado State University's June 10 forecast landed in the same place: 11 named storms, 5 hurricanes and 2 major hurricanes, about 60% of an average season, driven by the likelihood of a moderate to strong El Niño.
Does a below normal forecast lower 2026 hurricane season vendor demand?
Not in the way a capacity plan needs. NOAA says plainly that its outlook is not a landfall forecast. A season with few storms can still put one hurricane over a dense part of your book, and the tarping demand from that single landfall is what your vendor network has to handle.
CSU does publish landfall odds, and they show the same point. Its June forecast gave an 11% chance of a major hurricane making landfall on the U.S. East Coast including the Florida Peninsula, against an average of 21%, and a 14% chance for the Gulf Coast region that includes the Florida Panhandle, against an average of 27%. Lower is not zero. For a carrier with concentrated exposure in Florida, those numbers lower the odds of a big event; they do not change how big the event is if it comes.
Timing matters too. The National Hurricane Center puts the peak of the Atlantic season on September 10, with most activity between mid August and mid October. Capacity that is committed in June but released by the first week of September is committed for the wrong part of the year.
How should carriers turn a seasonal outlook into vendor capacity planning?
Treat the outlook as one input to a simple vendor capacity model, not as the model. The parts that drive tarping demand are mostly yours:
- Exposure by region: how many insured roofs sit in each coastal and inland market you write.
- A landfall scenario per region: the share of those roofs you would expect to need a tarp after a direct hit, based on your own past events.
- Crew throughput: how many roofs a vendor crew can tarp and fully document per day in post storm conditions.
- A target cycle time: how many days you are willing to let an open roof wait before interior water damage starts to drive severity.
The seasonal forecast then shifts how much standby capacity you hold and for how long. In a below normal year you may hold less idle capacity in early summer, but the commitment for the peak weeks should still be sized to your worst realistic landfall. Our cycle time benchmarks post covers what carriers usually measure.
What is the math behind buffer capacity?
The arithmetic is short. Take the roofs you expect to need tarps in your landfall scenario, divide by your target cycle time in days, and you get the number of roofs per day your network has to tarp. Divide that by crew throughput and you get the crews you need on the ground. Buffer capacity is everything above that line.
Here is a made up example to show the steps, not a benchmark. If a scenario produces 3,000 tarp assignments and you want them done in 10 working days, your network needs 300 roofs a day. At 5 documented roofs per crew per day, that is 60 crews. If your committed vendors can field 45 crews in that region, you have a 15 crew gap before anyone gets sick, a road closes or a crew is pulled to another market. Carriers who plan a buffer of committed crews above the base number, with materials staged, are the ones whose cycle time holds when the assignment wave peaks.
Two cautions. First, throughput drops after a storm because of access, debris and weather, so use post storm numbers, not blue sky numbers. Second, documentation is part of throughput. A roof is not finished until the photo set and report reach your claims system, so a vendor that tarps fast but files late still creates a backlog at review.
How can Tarpers fit into a 2027 vendor capacity plan?
Tarpers has completed 1,000+ tarp assignments across seven named storms, including 475+ assignments in under two months after Hurricane Milton. Teams mobilize within hours of a catastrophic event declaration with pre positioned equipment and trained crews, contact the property owner within hours of an assignment, and work dawn to dusk, 7 days a week. See how deployments are staffed on our catastrophe response page.
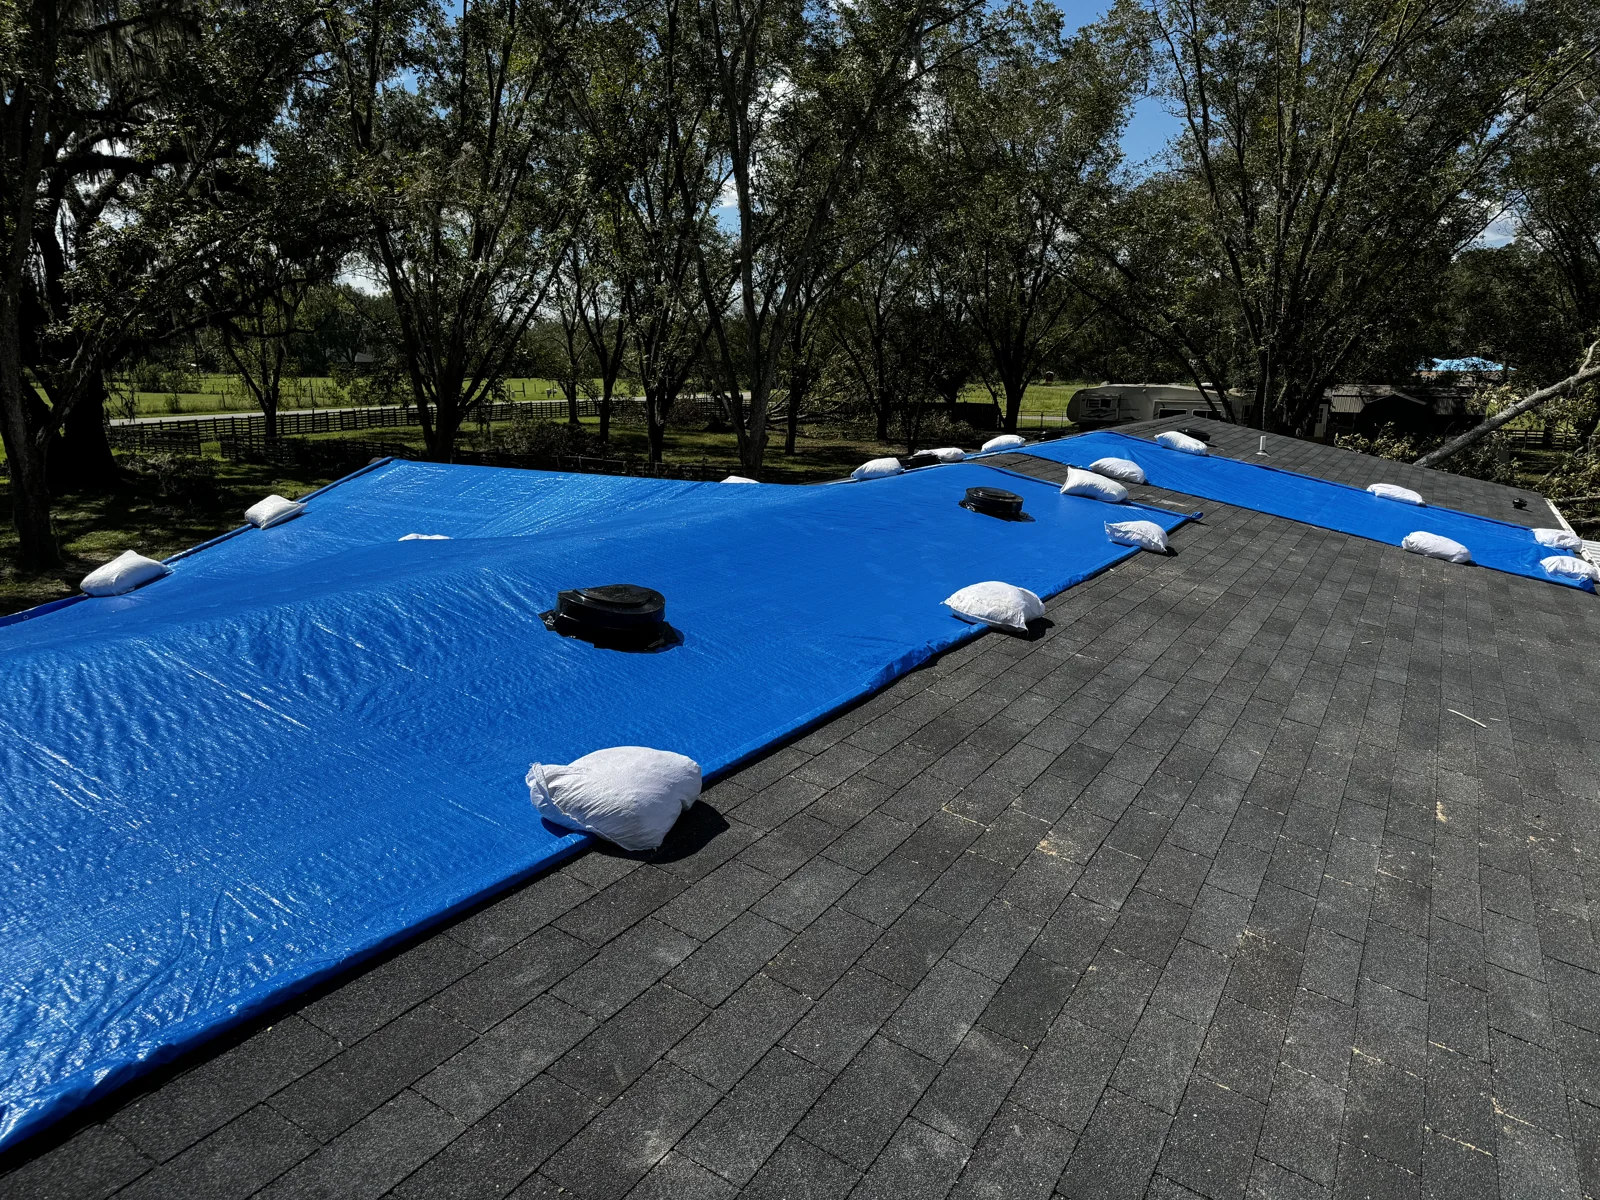
Every install uses a non-destructive method that anchors the tarp with TarpBags® or sandbags, chosen by the job and the logistics, so no new nail holes go into a roof that is already damaged. Tarps are a temporary fix that typically holds for weeks to a few months, varying case by case, which is why fast permanent repair scheduling still matters. Assignments come in through Xactware or Symbility, or by email or phone, every job is photographed before, during and after, and Tarpers invoices the carrier directly. The insurance vendors page explains how assignments flow.
If you are setting buffer capacity for next season, start on our insurance contact page or the main contact page, or call (833) 365-TARP.
Plan Next Season's Tarping Capacity With Tarpers
Tarpers works with carriers, TPAs and adjusters on non-destructive emergency tarping in Florida and Georgia. Call (833) 365-TARP or reach our insurance team online.